Monitoring Modem Signal Strength with Promethus
by Tykling
05. nov 2020 11:34 UTC
I've been playing with mobile modems recently, and found myself in need of a good way to monitor the signal strength of the modems. Standard AT commands can be used to query each modem about its (perceived) signal strength. I want to get these numbers periodically and put them into Prometheus so I can make myself a nice Grafana dashboard showing how my modems are doing.
This innocent sounding task ended up spawning a couple of new small software project to get the job done. First I needed something scriptable to send a command to a serial device and get the output, like an Expect script but from the commandline, without writing a script as such. Ideally I just wanted to do echo "AT" | something and get "OK" on stdout, so it was also usable as a general tool for quick little serial commands.
It turns out such a tool didn't really exist, or I was unable to find one at least. I decided to write one, and the result is PipeSerial (install from PyPi for now). I use it in the monitoring script to get the signal strength from my modems, but it could be used for any sort of serial device interaction where you need to send a payload to a serial device and return the output. It is just a wrapper around on pySerial and Pexpect (with the convenient pexpect-serial acting as glue between the two).
Once that was in place I needed something to use my new PipeSerial tool to get modem signal strength/quality and put it somewhere in a format which can be picked up by Prometheus. This became mobile_modem_exporter (install from PyPi for now), a Prometheus exporter which uses PipeSerial and the Python Prometheus client library to export the metrics I need to a location ingested by the Node Exporter Textfile Collector.
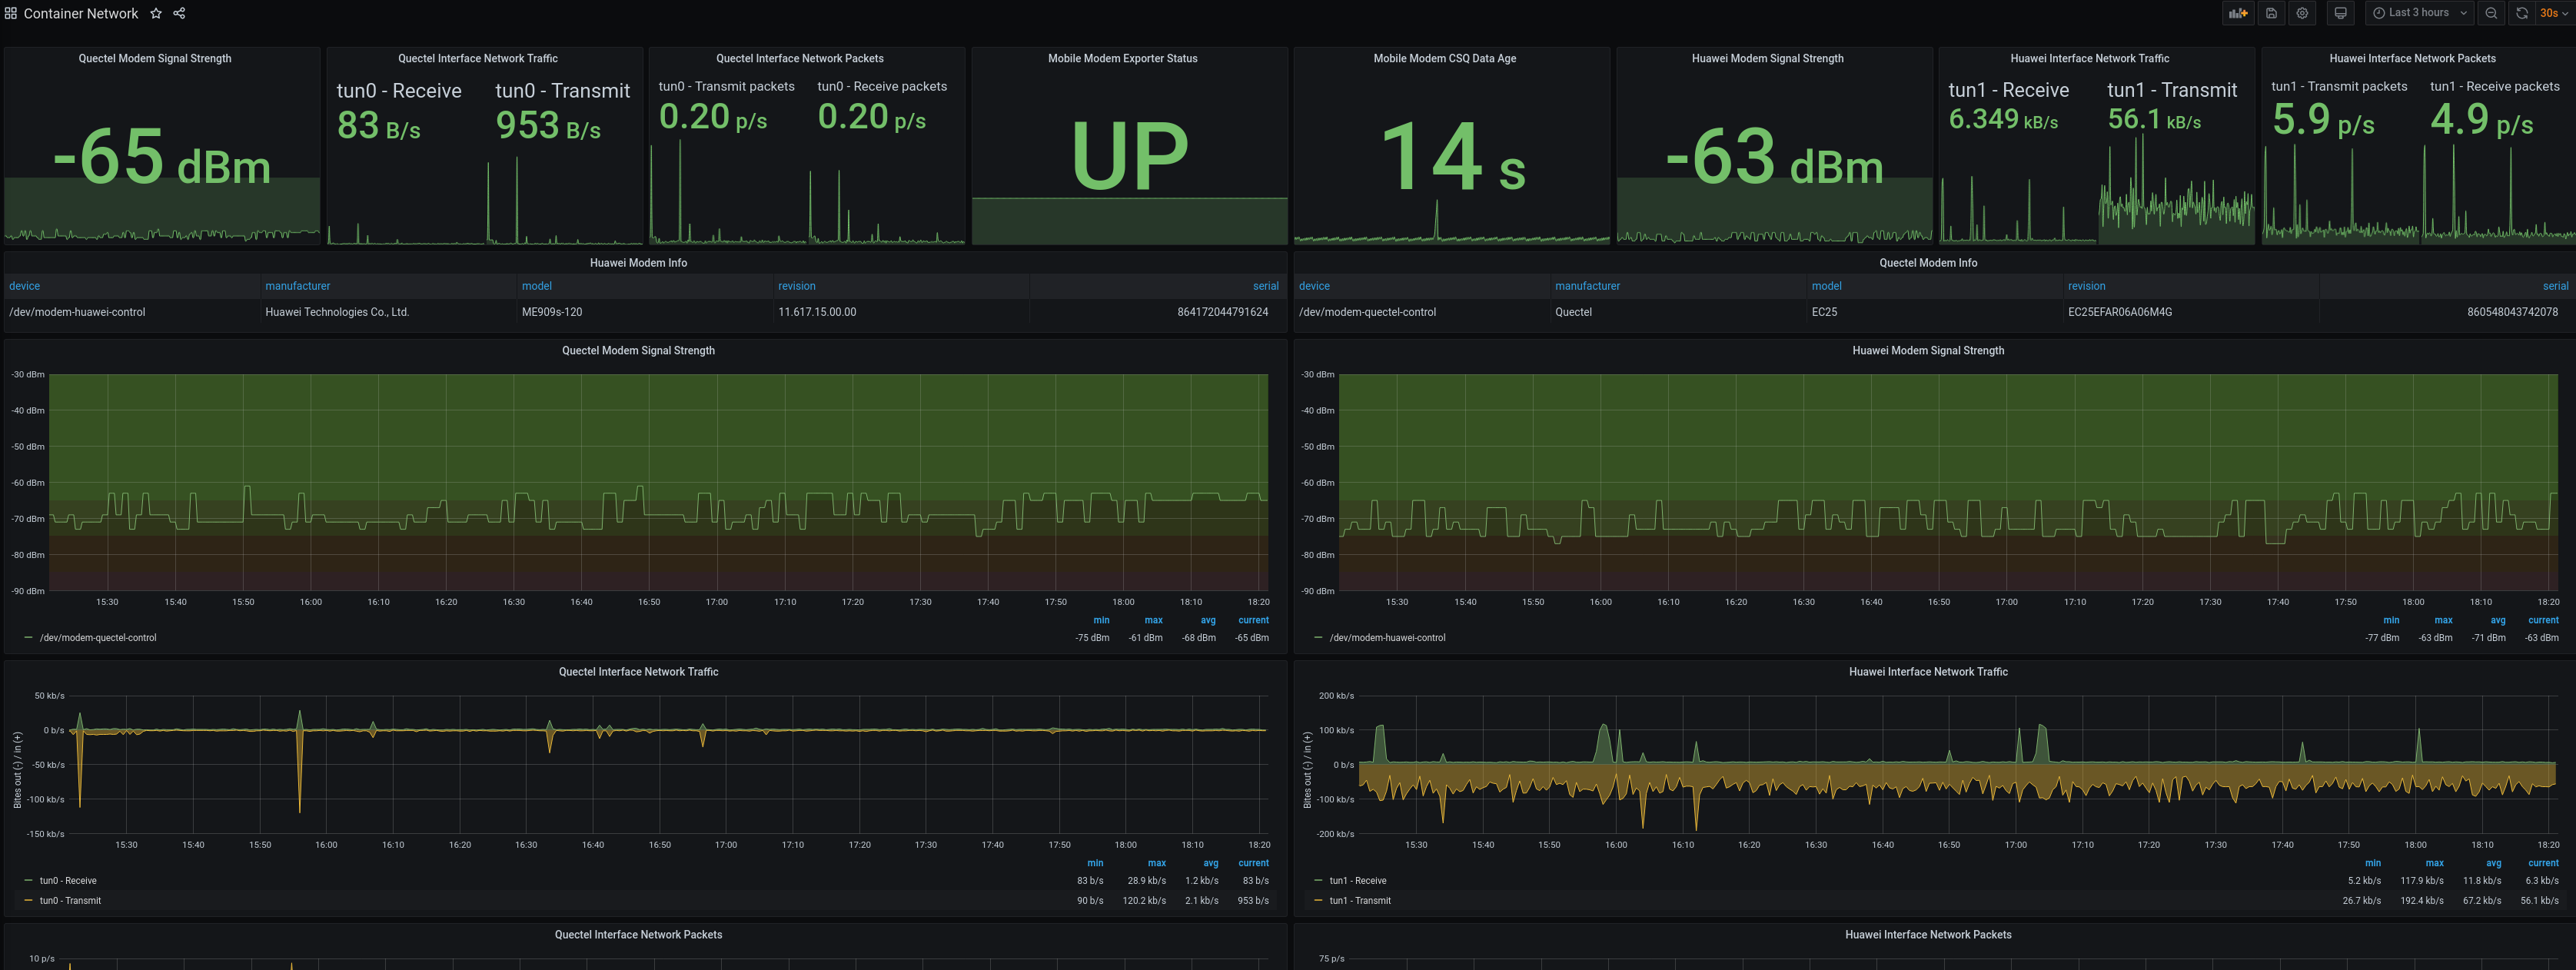
The finished dashboard looks like this. I've created alerts in Prometheus for low dBm, no traffic the interfaces and a few other things. I am pretty happy with it!
Getting the Data From the Modems
First things first: I need to get the raw data out of the modems. The AT+CSQ command is the standard method of getting signal strength information from the device, it should work on all mobile modems. Each vendor also may have some additional proprietary commands which can return more detailed information, but for this I am using AT+CSQ. The output looks like this:
AT+CSQ
+CSQ: 18,99

OK
With 18 being rssi and 99 being BER (which is not supported on these modems and thus always 99). An RSSI of 18 on this modem means a dBm of -77 (because (18*2)-113=-77, more info below).
Getting the data periodically with pipeserial is as simple as:
[tykling@container1 ~]$ while true; do date; echo "AT+CSQ" | sudo pipeserial /dev/modem-quectel-control ; sleep 10; done
Thu Nov  5 11:16:08 UTC 2020
AT+CSQ
+CSQ: 22,99

OK

Thu Nov  5 11:16:19 UTC 2020
AT+CSQ
+CSQ: 25,99

OK

Thu Nov  5 11:16:31 UTC 2020
AT+CSQ
+CSQ: 21,99

OK

^C
[tykling@container1 ~]$
Wrapping this in a script and grepping for ^+CSQ is enough to get something to work with, which is basically what mobile_modem_exporter does. I added an ansible task to install it in a virtualenv and run it under supervisord.
I then made supervisord run mobile_modem_exporter with the following supervisord.d config snippet:
[tykling@container1 ~]$ cat /usr/local/etc/supervisord.d/mobile_modem_exporter.conf
; run mobile_modem_exporter
[program:mobile_modem_exporter]
command=/usr/local/bin/mobile_modem_exporter /var/tmp/node_exporter/mobile_modem.prom /dev/modem-huawei-control /dev/modem-quectel-control
user=root
stdout_syslog=True
stderr_syslog=True
startsecs=5
autostart=True
[tykling@container1 ~]$
The output ends up in /var/tmp/node_exporter/mobile_modem.prom and looks like this:
[tykling@container1 ~]$ cat /var/tmp/node_exporter/mobile_modem.prom
# HELP mobile_modem_up This metric is always 1 if the mobile_modem scrape worked, 0 if there was a problem getting info from one or more modems.
# TYPE mobile_modem_up gauge
mobile_modem_up 1.0
# HELP mobile_modem_build_info Information about the mobile_modem_exporter itself.
# TYPE mobile_modem_build_info gauge
mobile_modem_build_info{pipeserial_version="0.3.0",version="0.1.0"} 1.0
# HELP mobile_modem_info Information about the mobile modem being monitored, including device path, manufacturer, model, revision and serial number.
# TYPE mobile_modem_info gauge
mobile_modem_info{device="/dev/modem-huawei-control",manufacturer="Huawei Technologies Co., Ltd.",model="ME909s-120",revision="11.617.15.00.00",serial="864172044791624"} 1.0
mobile_modem_info{device="/dev/modem-quectel-control",manufacturer="Quectel",model="EC25",revision="EC25EFAR06A06M4G",serial="860548043742078"} 1.0
# HELP mobile_modem_atcsq_rssi RSSI for the mobile modem as returned by AT+CSQ
# TYPE mobile_modem_atcsq_rssi gauge
mobile_modem_atcsq_rssi{device="/dev/modem-huawei-control"} 19.0
mobile_modem_atcsq_rssi{device="/dev/modem-quectel-control"} 25.0
# HELP mobile_modem_atcsq_ber BER for the mobile modem as returned by AT+CSQ
# TYPE mobile_modem_atcsq_ber gauge
mobile_modem_atcsq_ber{device="/dev/modem-huawei-control"} 99.0
mobile_modem_atcsq_ber{device="/dev/modem-quectel-control"} 99.0
[tykling@container1 ~]$
As you can see the mobile_modem_exporter also exports a mobile_modem_info metric which has metadata about each modem. It exports manufacturer, model, revision and serial number for each modem. This information is displayed in the tables between the Stat panels in the top and the dBm graphs.
Node Exporter will automatically pick up the new metrics from the .prom file as often as it is scraped by Prometheus, and they are immediately available in Prometheus and Grafana for visualisation.
Convert RSSI to dBm
While the rssi number itself is a subjective (and manufacturer specific) value, the AT command reference for a modem should contain the information needed to convert the rssi number to dBm (decibels per miliwatt) which is a standard and comparable unit of measurement. I found the conversion ratio in the AT+CSQ command description in the AT Command Reference for my two modems (Huawei, Quectel).
The two modems I have in this server fortunately both use more or less the same scale (at least in the sweet spot where the modems are likely to be operating). The formula is (rssi * 2) - 113 which results in a dBm value that is (more) comparable across the two (and other) modems. I add this as a Prometheus recording rule so I have the dBm value available always. The recording rule is simple:
[tykling@prometheus1 ~]$ cat /usr/local/etc/prometheus-rules.yml
---
groups:
  - name: modem-exporter-group
    rules:
      - expr: (mobile_modem_atcsq_rssi * 2) - 113
        record: mobile_modem_atcsq_dbm
[tykling@prometheus1 ~]$
I have other recording rules but they are not relevant for this. This recording rule makes the new metric mobile_modem_atcsq_dbm available with the same timestamps and labels as the original mobile_modem_atcsq_rssi metric has. I don't actually use mobile_modem_atcsq_rssi in any graphs.
For the record, the color thresholds I've defined in Grafana for the dBm graphs are:
- excellent is > -65 dBm
- good is -75 to -65 dBm
- fair is -85 to -75 dBm
- poor is -95 to -85 dBm
- and lower than -95 dBm is no signal
Note that the values above are for LTE networks, if the modems switch to GSM or something else I will need to use different thresholds. This gives me a pair of dBm graphs which looks like this:
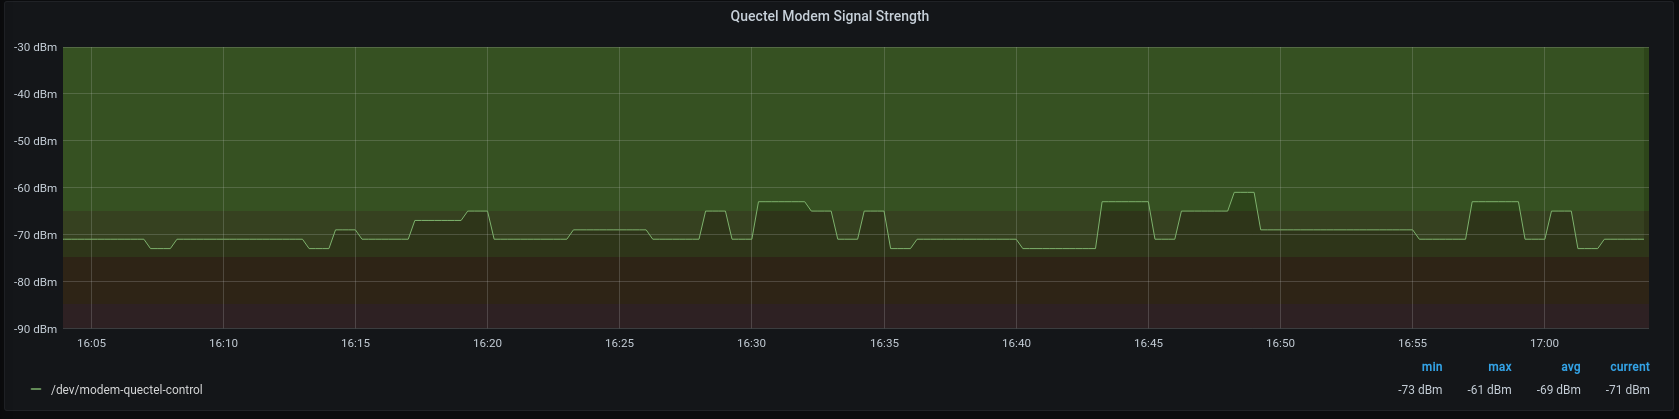
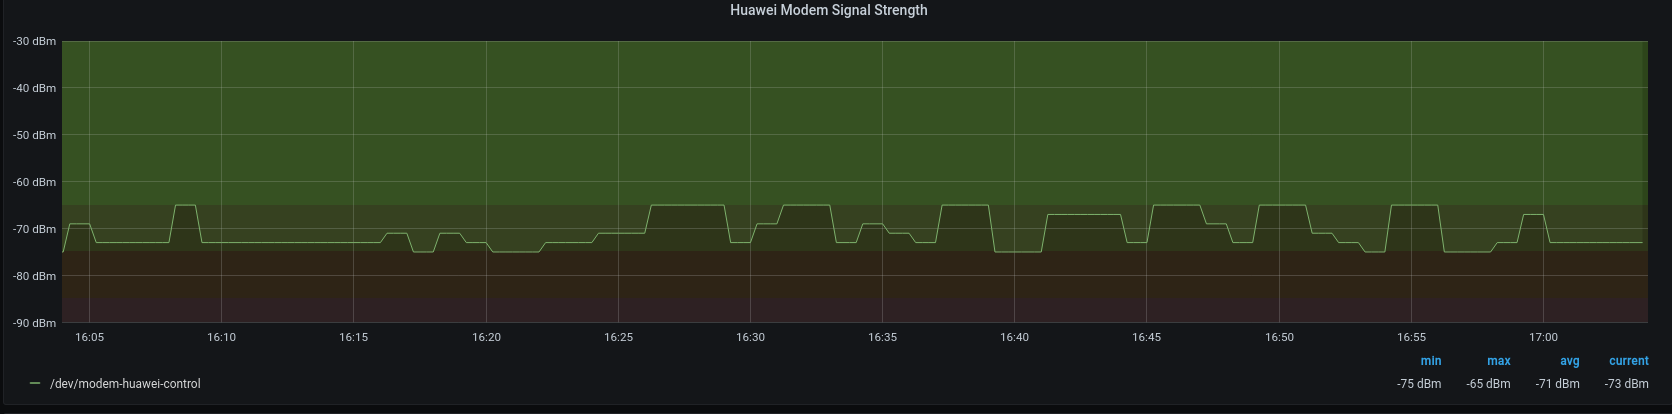
These graphs will serve us well both when we go to mount the antennas in their permanent location (readings every 10 seconds is wonderful when adjusting antenna angles!) and they will also be great to have in the future when troubleshooting connectivity or whatever.
Final Thoughts
This took longer than expected, but it did spawn a couple of nice small tools along the way! Stuff like this can always be done faster by yoloing a shell script here and there, and it might work for a while, but in my experience it always breaks eventually. Additionally, little crappy shell scripts are unlikely to be reused by others - people might as well write their own little crappy shell script.
In contrast, a properly linted, documented, tested and packaged tool is so much more likely to benefit others, or attract new contributors and become even better. Finally a well crafted utility is much nicer to work with. It has the -v knob to show the version, and it does as you would expect when you type -h and so on.
No matter what the future brings for the two new tools PipeSerial and mobile_modem_exporter I am really happy knowing that they are already useful for providing metrics about the BornHack infrastructure. And if I ever run into a similar task in the future I have the tools to handle it!
Donating
I've recently signed up for Github Sponsors meaning it is now easy to sponsor me and my work. If this post or some of my other writing, software or services have helped you then you can consider becoming a sponsor.