All in a days work: Prometheus gstat_exporter and Grafana Dashboard
by Tykling
18. nov 2019 19:10 UTC
Background
This morning I decided to write a gstat_exporter to make gstat data available to Prometheus.
Prometheus is a wonderful timeseries database, monitoring tool, and software ecosystem really. It is still new but it is quickly gaining traction all over. For example, FreeBSD 12 got a prometheus_sysctl_exporter(8) in base, which can output all the values from sysctl in a Prometheus friendly format, and it can even run through inetd and thus be used directly by Prometheus.
Prometheus main system metrics exporter is called node_exporter, which is in Ports, and which exports a lot of nice metrics about FreeBSD, but nothing about disk utilisation, and nothing about ZFS. This leaves us a bit blind when investigating storage performance issues. Prometheus has great support for stuff like disk stats on Linux but that doesn't really help here.
gstat(8) is a top-style command-line utility to show the utilisation of GEOM devices in FreeBSD. It has flags to tell it to output in a script-friendly format:
$ gstat -pdosCI 5s
timestamp,name,q-depth,total_ops/s,read/s,read_sz-KiB,read-KiB/s,ms/read,write/s,write_sz-KiB,write-KiB/s,ms/write,delete/s,delete-sz-KiB,delete-KiB/s,ms/delete,other/s,ms/other,%busy
2019-11-18 17:40:19.791424402,ada0,0,0,0,0,0,0.0,0,0,0,0.0,0,0,0,0.0,0,0.0,0.0
2019-11-18 17:40:24.833797791,ada0,0,32,0,4,1,2.0,31,12,374,0.1,0,0,0,0.0,0,3.1,0.4
2019-11-18 17:40:29.845050898,ada0,0,28,0,0,0,0.0,28,10,287,0.1,0,0,0,0.0,0,3.0,0.3
^C
$
This seems ideal for combining with the lovely Prometheus Exporter Python Module which I've used a few times before, it works great and is easy to use.
The Code
I started coding and pretty quickly had a crude POC which worked well. I spent some extra time nursing the data for the labels, since it adds so much to have extra dimensions to the data
The finished Python script is just over 400 lines, which includes formatting with black, so it sounds worse than it really is. This is because black prefers readable code over compact code.
The code is contained in two main functions, get_deviceinfo() and process_request().
get_deviceinfo()takes care of runninggeom -p $devicenameto get info about a disk when we first encounter it. This makes it possible to have nice labels on the metrics like disk serial, size, rpm and such.process_request()is the main function which runsgstatand waits for output, parses the output, and uses it to update the metrics.
Prometheus maintains a registry of port numbers for exporters like the one you are reading about now. The list can be found on Github and I've allocated port number 9248 for gstat_exporter.
The Metrics
Finally the script defines the actual metrics. The Prometheus library auto-adds some metrics about the Python environment, but other than that all 17 values provided by gstat are exposed, with the following metric names and descriptions:
$ fetch -qo - http://127.0.0.1:9248 | grep HELP | grep gstat
# HELP gstat_up The value of this Gauge is always 1 when the gstat_exporter is up
# HELP gstat_queue_depth The queue depth for this GEOM
# HELP gstat_total_operations_per_second The total number of operations/second for this GEOM
# HELP gstat_read_operations_per_second The number of read operations/second for this GEOM
# HELP gstat_read_size_kilobytes The size in kilobytes of read operations for this GEOM
# HELP gstat_read_kilobytes_per_second The speed in kilobytes/second of read operations for this GEOM
# HELP gstat_miliseconds_per_read The speed in miliseconds/read operation for this GEOM
# HELP gstat_write_operations_per_second The number of write operations/second for this GEOM
# HELP gstat_write_size_kilobytes The size in kilobytes of write operations for this GEOM
# HELP gstat_write_kilobytes_per_second The speed in kilobytes/second of write operations for this GEOM
# HELP gstat_miliseconds_per_write The speed in miliseconds/write operation for this GEOM
# HELP gstat_delete_operations_per_second The number of delete operations/second for this GEOM
# HELP gstat_delete_size_kilobytes The size in kilobytes of delete operations for this GEOM
# HELP gstat_delete_kilobytes_per_second The speed in kilobytes/second of delete operations for this GEOM
# HELP gstat_miliseconds_per_delete The speed in miliseconds/delete operation for this GEOM
# HELP gstat_other_operations_per_second The number of other operations (BIO_FLUSH)/second for this GEOM
# HELP gstat_miliseconds_per_other The speed in miliseconds/other operation (BIO_FLUSH) for this GEOM
# HELP gstat_percent_busy The percent of the time this GEOM is busy
$
Sample Output
Some sample output from a server where I grep the output of just a single disk:
$ fetch -qo - http://127.0.0.1:9248 | grep da0
gstat_queue_depth{descr="ATA HGST HUS726040AL",fwheads="255",fwsectors="63",ident="NHGK994Y",lunid="5000cca243c7dd33",mediasize="4000787030016 (3.6T)",name="da0",rotationrate="7200",sectorsize="512"} 0.0
gstat_total_operations_per_second{descr="ATA HGST HUS726040AL",fwheads="255",fwsectors="63",ident="NHGK994Y",lunid="5000cca243c7dd33",mediasize="4000787030016 (3.6T)",name="da0",rotationrate="7200",sectorsize="512"} 44.0
gstat_read_operations_per_second{descr="ATA HGST HUS726040AL",fwheads="255",fwsectors="63",ident="NHGK994Y",lunid="5000cca243c7dd33",mediasize="4000787030016 (3.6T)",name="da0",rotationrate="7200",sectorsize="512"} 6.0
gstat_read_size_kilobytes{descr="ATA HGST HUS726040AL",fwheads="255",fwsectors="63",ident="NHGK994Y",lunid="5000cca243c7dd33",mediasize="4000787030016 (3.6T)",name="da0",rotationrate="7200",sectorsize="512"} 20.0
gstat_read_kilobytes_per_second{descr="ATA HGST HUS726040AL",fwheads="255",fwsectors="63",ident="NHGK994Y",lunid="5000cca243c7dd33",mediasize="4000787030016 (3.6T)",name="da0",rotationrate="7200",sectorsize="512"} 118.0
gstat_miliseconds_per_read{descr="ATA HGST HUS726040AL",fwheads="255",fwsectors="63",ident="NHGK994Y",lunid="5000cca243c7dd33",mediasize="4000787030016 (3.6T)",name="da0",rotationrate="7200",sectorsize="512"} 9.6
gstat_write_operations_per_second{descr="ATA HGST HUS726040AL",fwheads="255",fwsectors="63",ident="NHGK994Y",lunid="5000cca243c7dd33",mediasize="4000787030016 (3.6T)",name="da0",rotationrate="7200",sectorsize="512"} 37.0
gstat_write_size_kilobytes{descr="ATA HGST HUS726040AL",fwheads="255",fwsectors="63",ident="NHGK994Y",lunid="5000cca243c7dd33",mediasize="4000787030016 (3.6T)",name="da0",rotationrate="7200",sectorsize="512"} 41.0
gstat_write_kilobytes_per_second{descr="ATA HGST HUS726040AL",fwheads="255",fwsectors="63",ident="NHGK994Y",lunid="5000cca243c7dd33",mediasize="4000787030016 (3.6T)",name="da0",rotationrate="7200",sectorsize="512"} 1551.0
gstat_miliseconds_per_write{descr="ATA HGST HUS726040AL",fwheads="255",fwsectors="63",ident="NHGK994Y",lunid="5000cca243c7dd33",mediasize="4000787030016 (3.6T)",name="da0",rotationrate="7200",sectorsize="512"} 0.7
gstat_delete_operations_per_second{descr="ATA HGST HUS726040AL",fwheads="255",fwsectors="63",ident="NHGK994Y",lunid="5000cca243c7dd33",mediasize="4000787030016 (3.6T)",name="da0",rotationrate="7200",sectorsize="512"} 0.0
gstat_delete_size_kilobytes{descr="ATA HGST HUS726040AL",fwheads="255",fwsectors="63",ident="NHGK994Y",lunid="5000cca243c7dd33",mediasize="4000787030016 (3.6T)",name="da0",rotationrate="7200",sectorsize="512"} 0.0
gstat_delete_kilobytes_per_second{descr="ATA HGST HUS726040AL",fwheads="255",fwsectors="63",ident="NHGK994Y",lunid="5000cca243c7dd33",mediasize="4000787030016 (3.6T)",name="da0",rotationrate="7200",sectorsize="512"} 0.0
gstat_miliseconds_per_delete{descr="ATA HGST HUS726040AL",fwheads="255",fwsectors="63",ident="NHGK994Y",lunid="5000cca243c7dd33",mediasize="4000787030016 (3.6T)",name="da0",rotationrate="7200",sectorsize="512"} 0.0
gstat_other_operations_per_second{descr="ATA HGST HUS726040AL",fwheads="255",fwsectors="63",ident="NHGK994Y",lunid="5000cca243c7dd33",mediasize="4000787030016 (3.6T)",name="da0",rotationrate="7200",sectorsize="512"} 0.0
gstat_miliseconds_per_other{descr="ATA HGST HUS726040AL",fwheads="255",fwsectors="63",ident="NHGK994Y",lunid="5000cca243c7dd33",mediasize="4000787030016 (3.6T)",name="da0",rotationrate="7200",sectorsize="512"} 35.4
gstat_percent_busy{descr="ATA HGST HUS726040AL",fwheads="255",fwsectors="63",ident="NHGK994Y",lunid="5000cca243c7dd33",mediasize="4000787030016 (3.6T)",name="da0",rotationrate="7200",sectorsize="512"} 8.7
$
Using these labels it is easy to filter and group the data in graphs that make sense. Want to know how much faster your 7200rpm drives are compared to your 5400rpm ones? Just use the rotationrate label to compare them. Want to see just the 3TB drives? No problem. You can even see the serial number if you need it!
Deploying gstat_exporter
Afternoon was upon me, but I now have a working exporter! Next step is to get a nice reproducible way of deploying it on many servers. Since I am deep in the Ansible jungle this means writing some tasks in an Ansible role in my case.
I use exporter_exporter as a reverse proxy for all the exporters I run on a machine/in a jail. exporter_exporter listens on port 9999 and has a simple config which defines which module/exporter names run on which port. I put all of this in Ansible of course, so I don't have to fiddle with it manually. The Ansible role which installs all my Prometheus exporter stuff is prometheus_monitored_server and the specific tasks that take care of installing gstat_exporter are here. If you don't speak Ansible it can be summed up as:
- Get sourcecode
- Create virtualenv
- Install requirements.txt
- Run with supervisord
Currently gstat_exporter has no configurable options. It also doesn't really output anything. But when running it listens on port 9248 and responds to HTTP requests with gstat metrics. It gets new metrics every 5 seconds, but this will probably be configurable in a future version.
Grafana Dashboard
Evening has arrived, and everything is shaping up great. However, Prometheus is not much of a graph tool, and of course all this nice GEOM data deserves to be visualised in a pretty way. Prometheus and Grafana work great together, so the next step is to create a Grafana dashboard.
Creating dashboards is fiddly business which requires patience, and an eye for layout, and many other qualities I do not possess. I did end up with something kind of cool though, and this is still just a first stab at it, so expect improvements when I get input from coworkers and community!
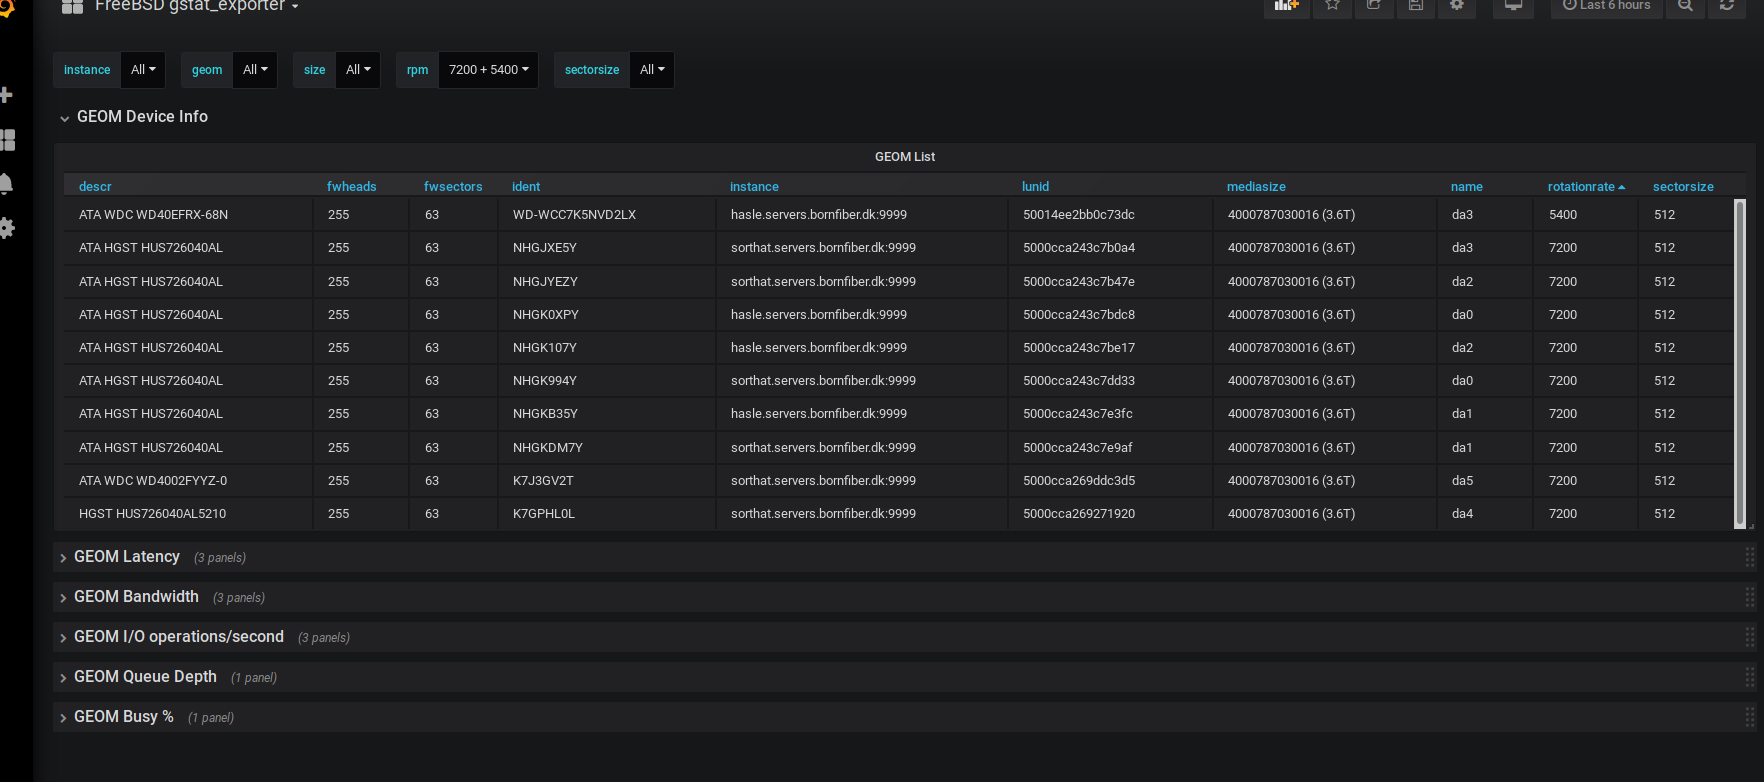
I've published the dashboard at the official Grafana Dashboard Registry and I've included a few screenshots with descriptions below.
I am particularly happy with the quick overview of the devices currently being shown. The power of Prometheus labels!
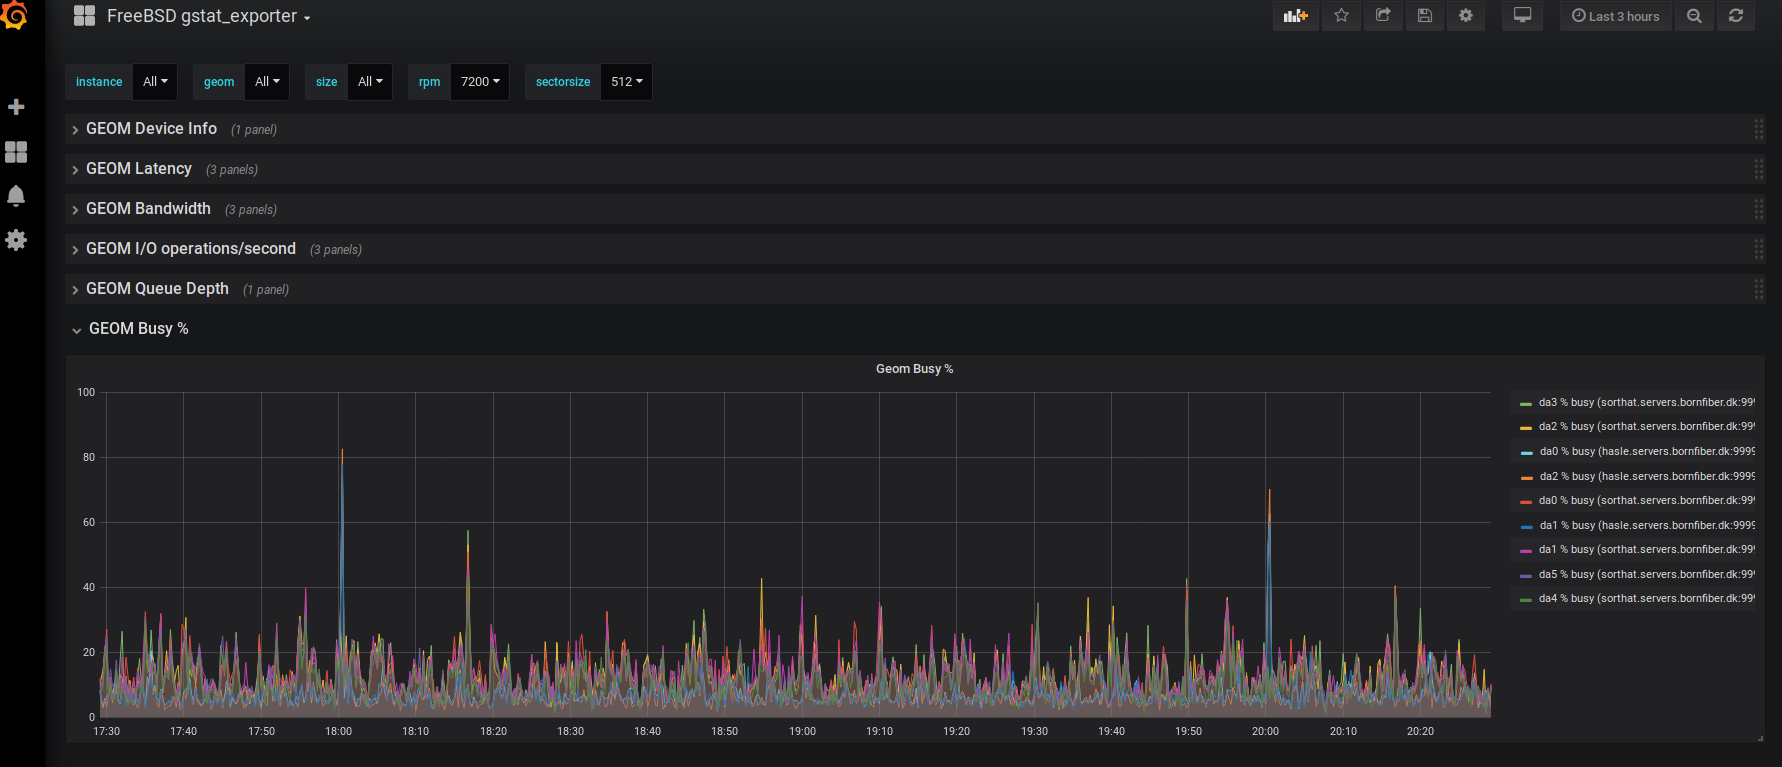
The % busy view, showing how much of the time a GEOM is busy.
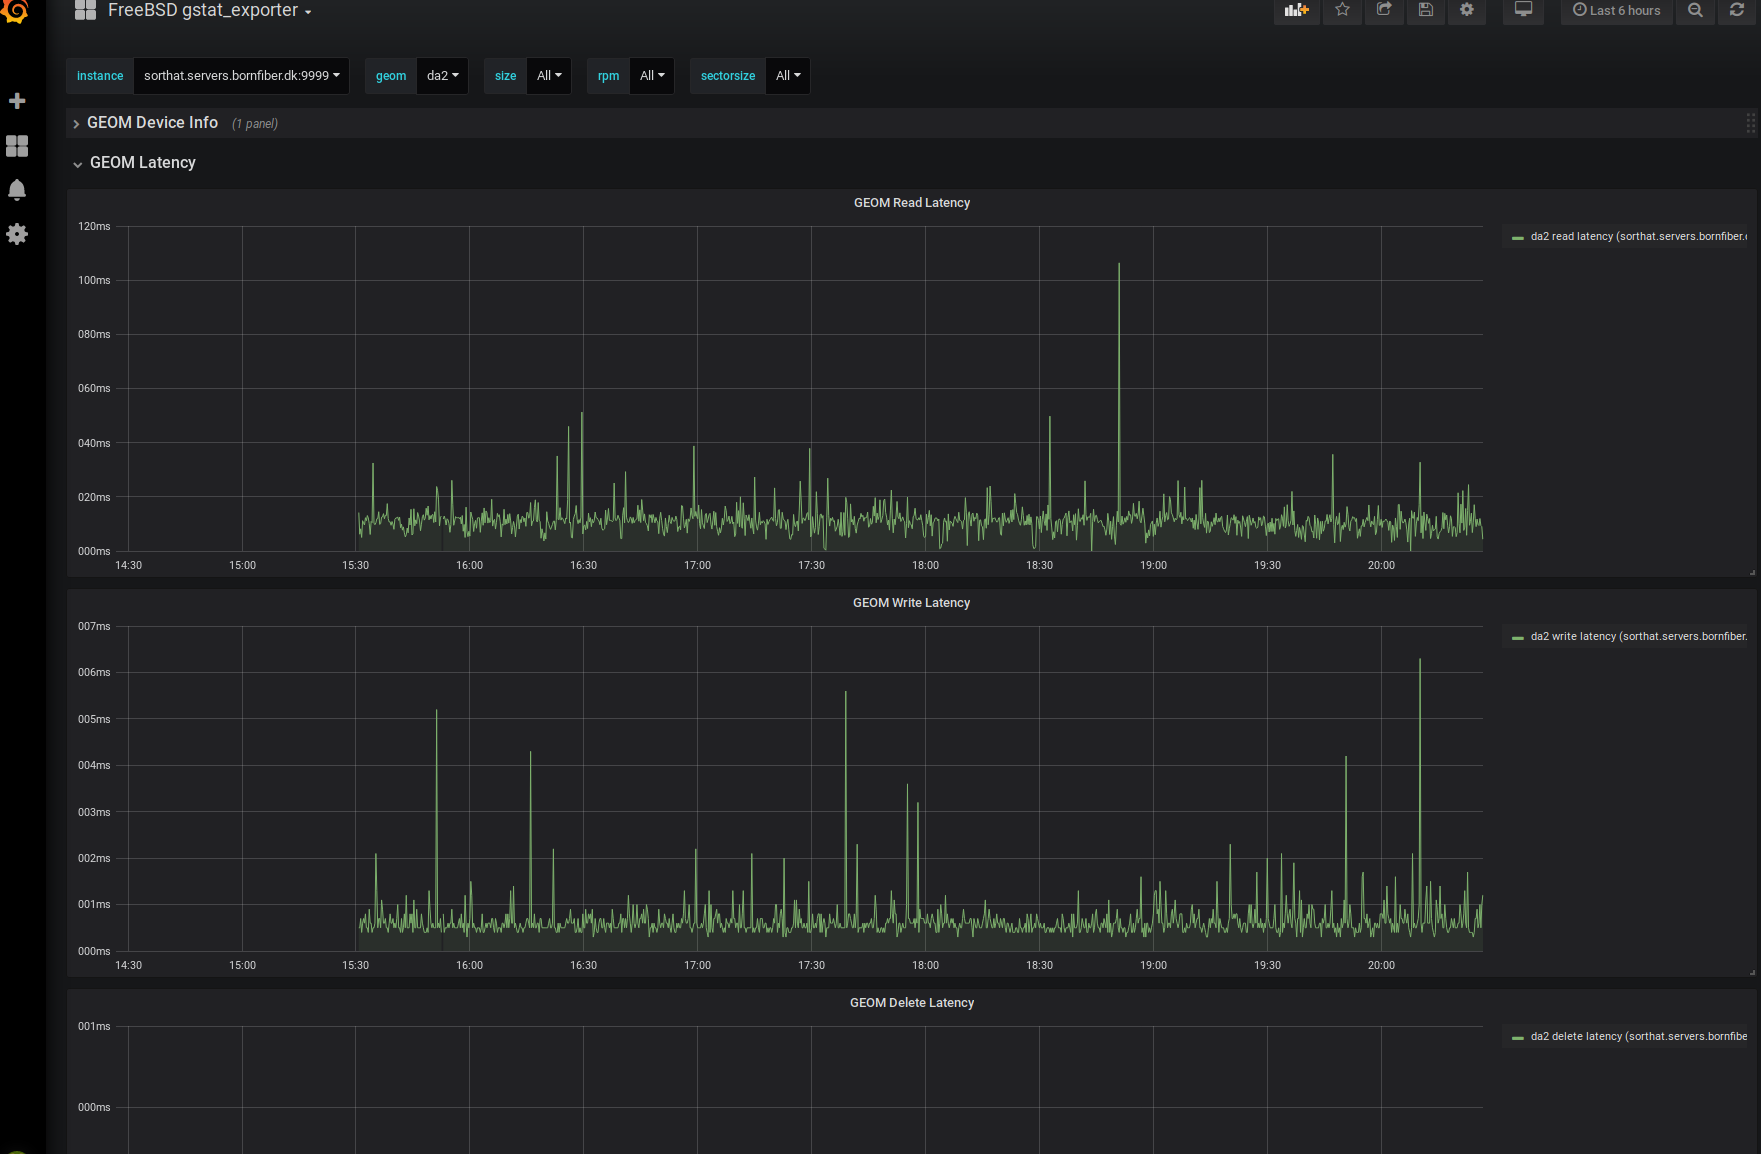
The GEOM latency graph, showing average ms/operation.
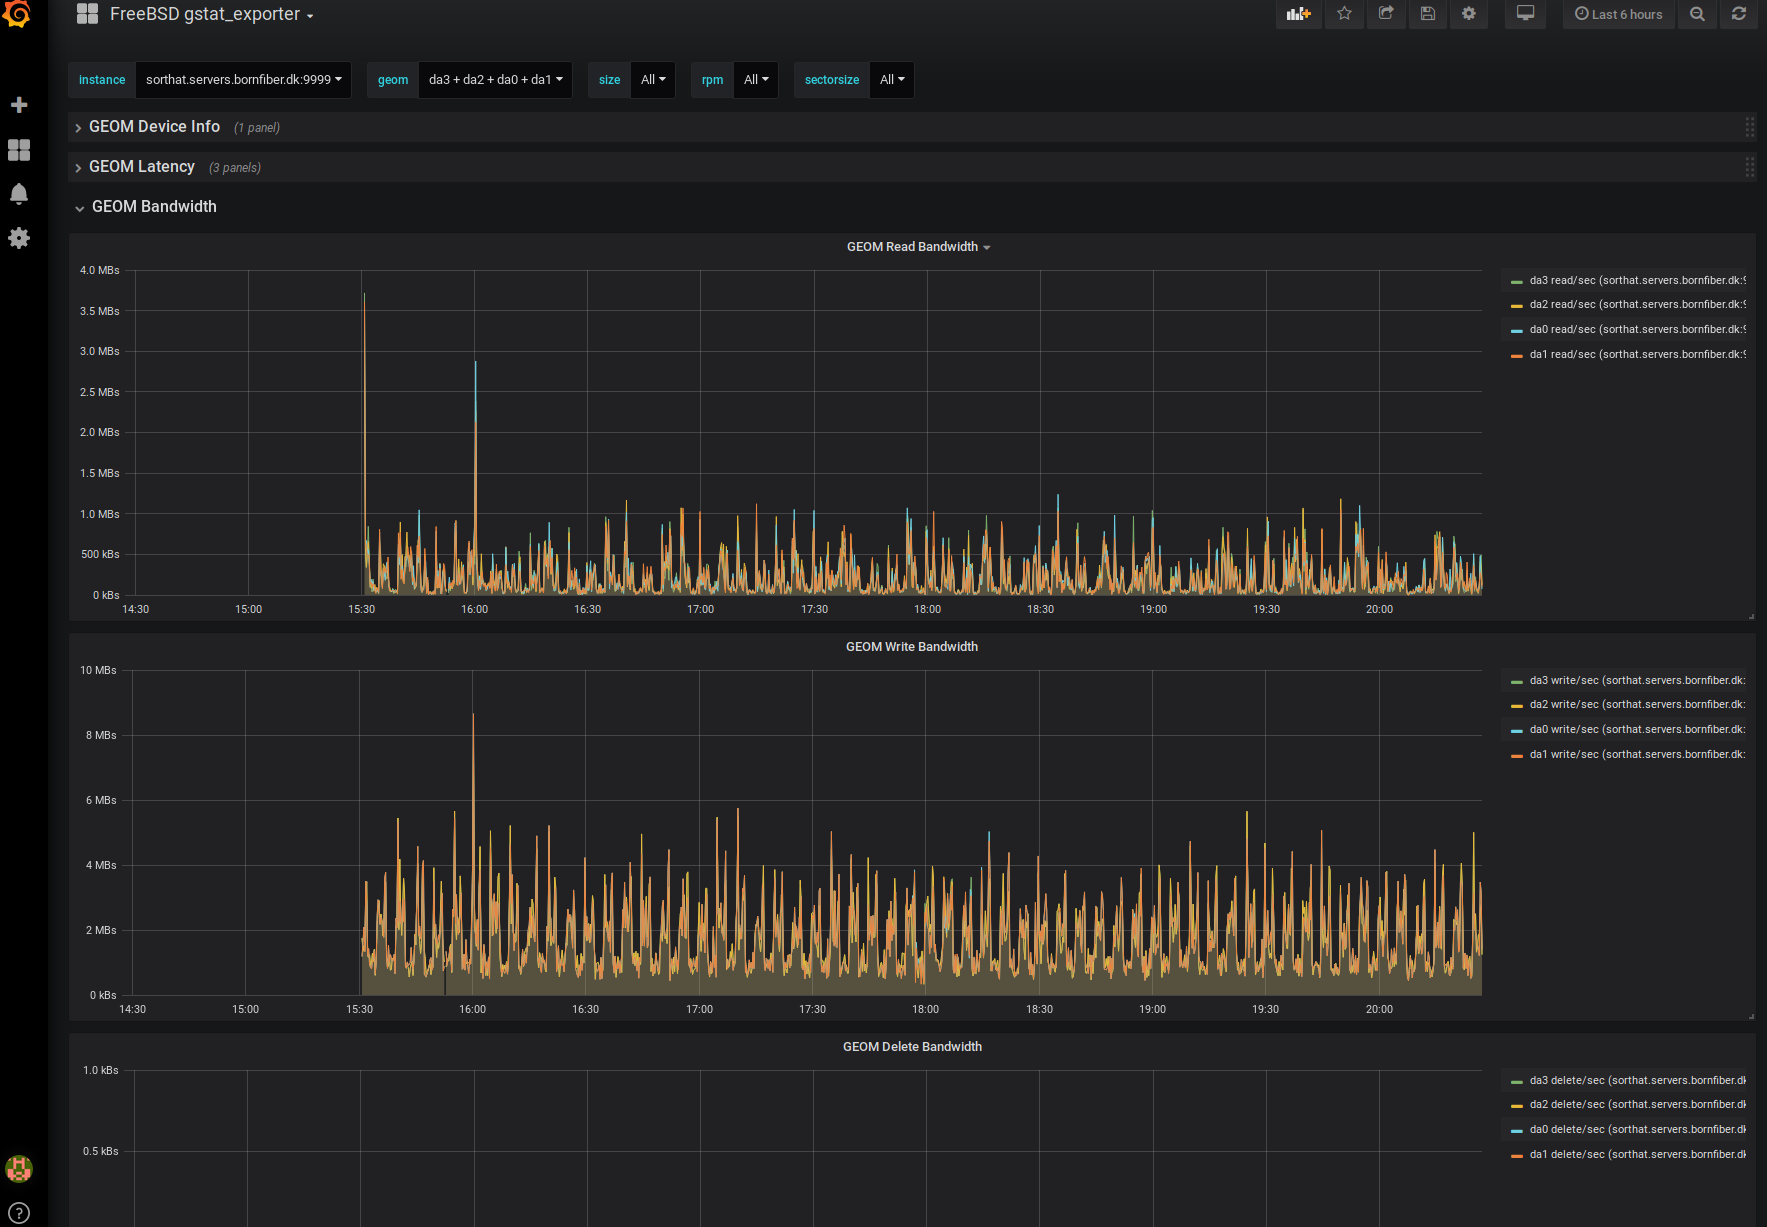
The GEOM bandwidth graph, showing how much data is read from/written to/deleted from the GEOM.
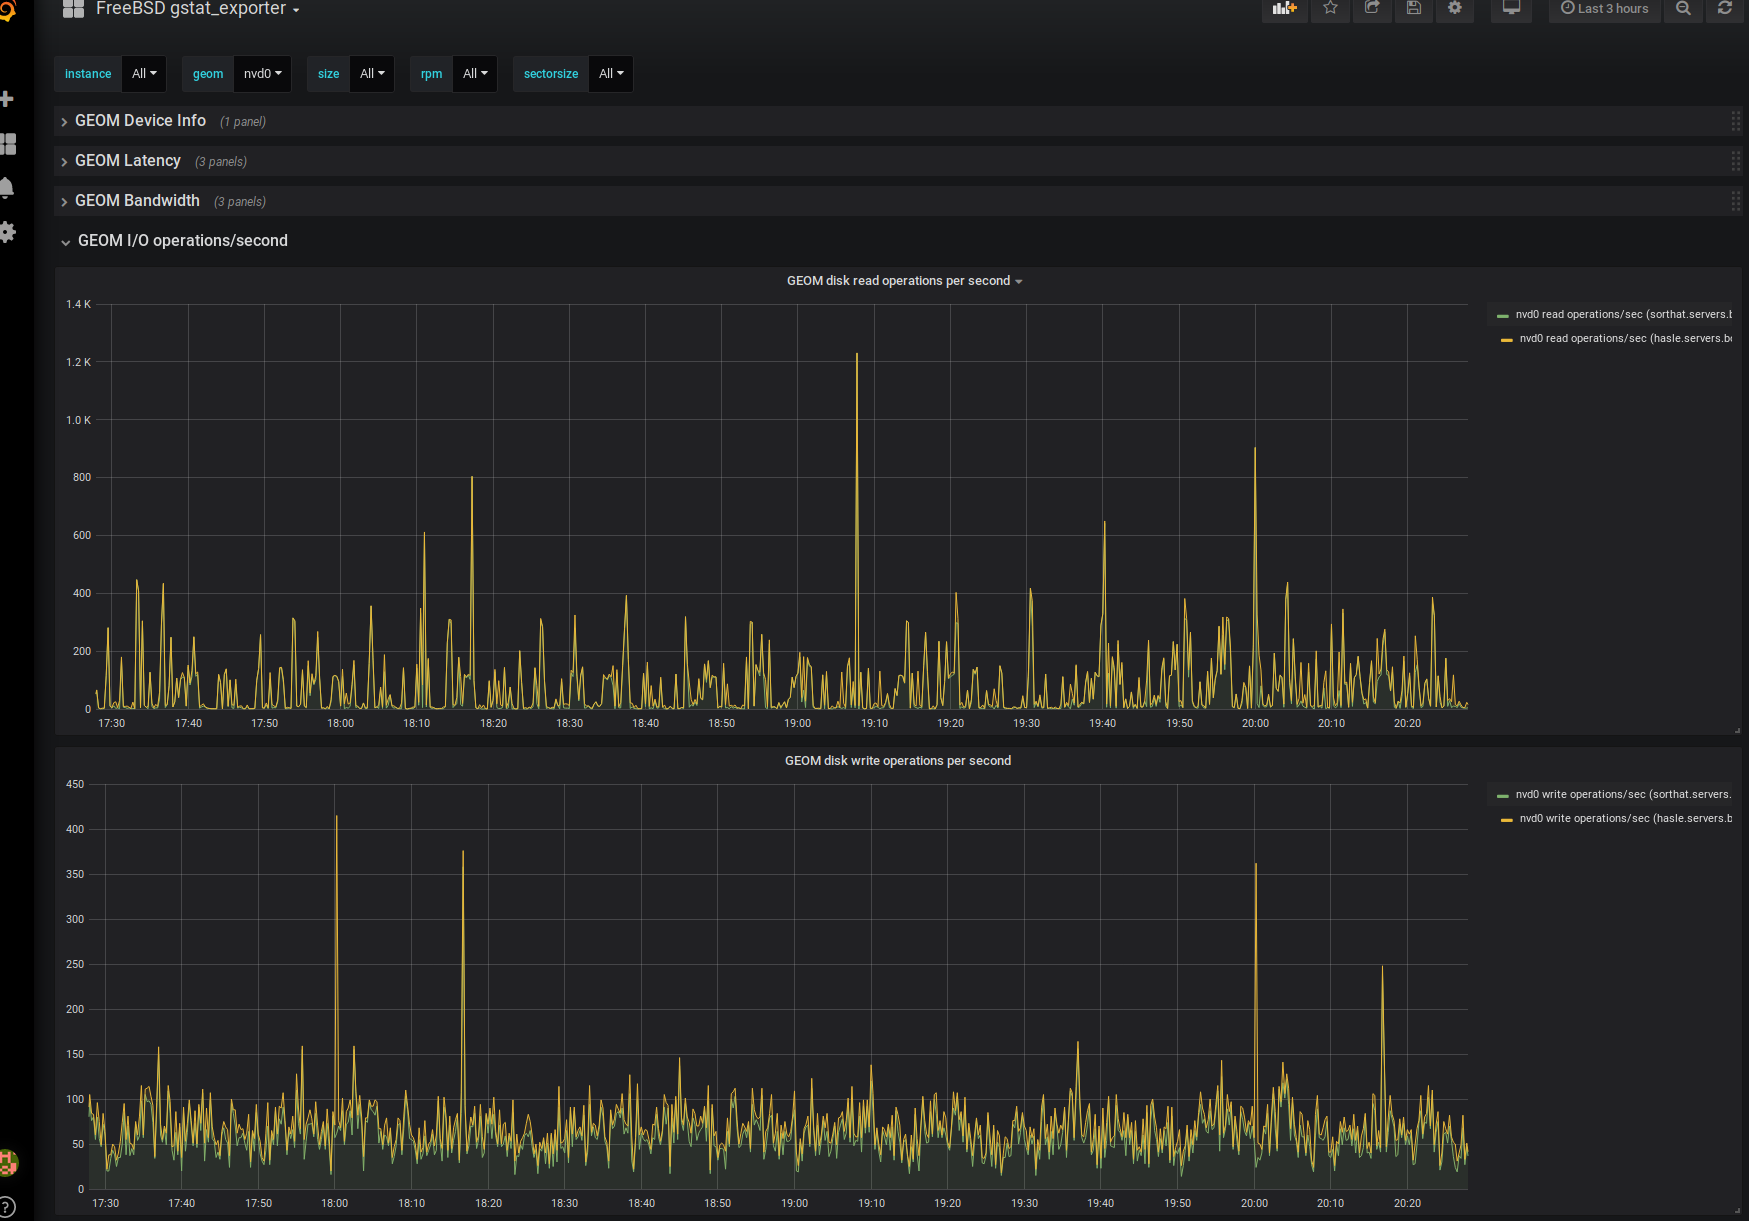
The GEOM IOPS graph.
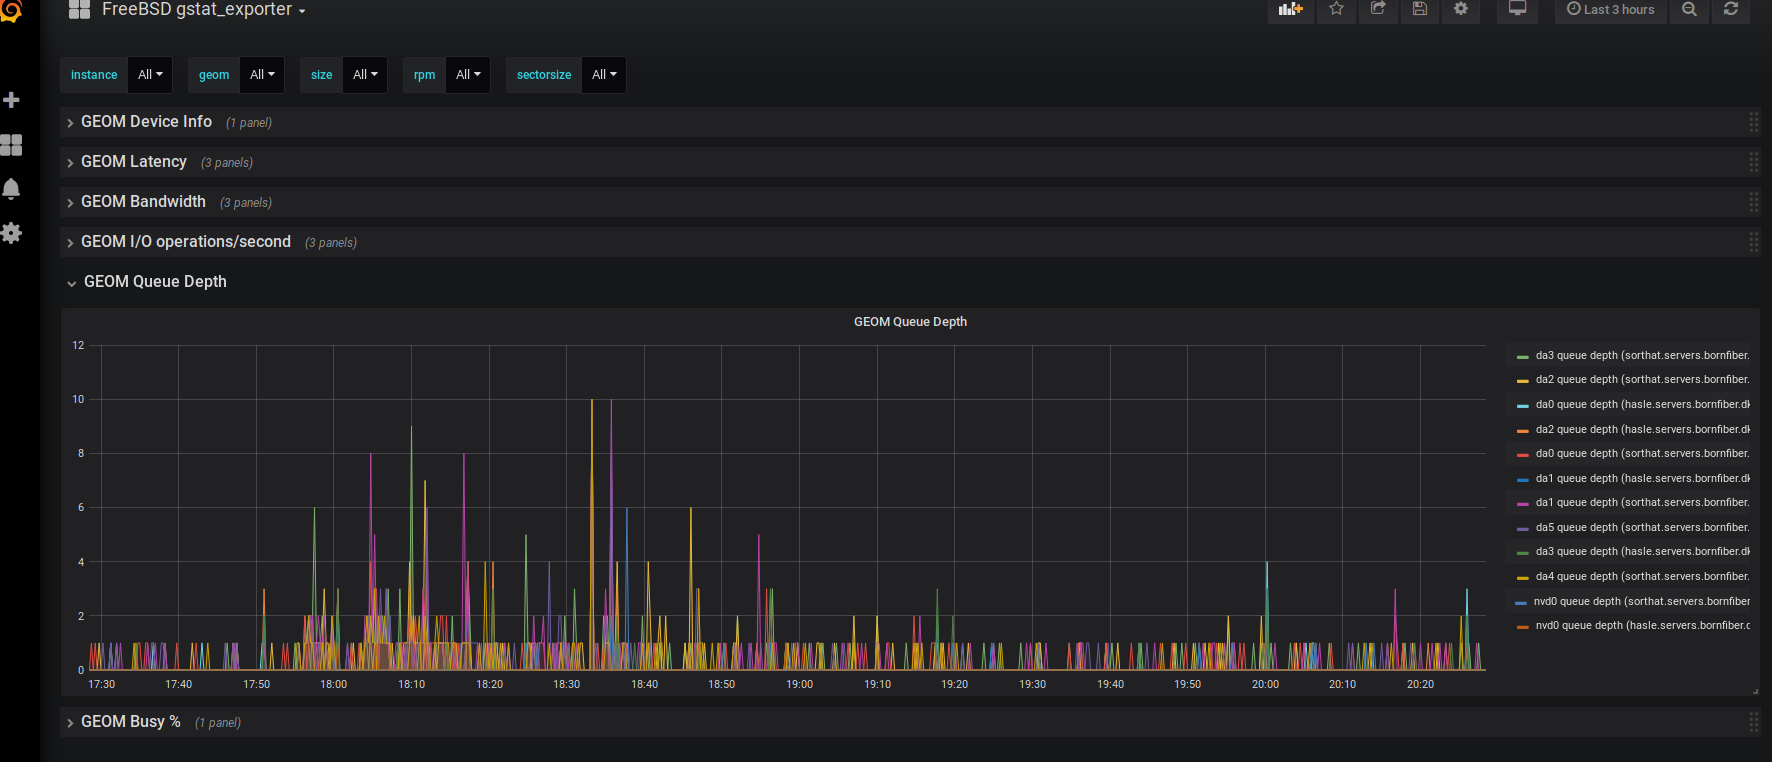
The GEOM queue depth graph.
12 Hours Later
This took all day. I spent about a third of the time (or 4 hours) writing the exporter, another 4 hours testing, fixing various issues and getting the code in shape, and the last third of the day was spent with Grafana studying my new data, making graphs, and finally publishing the Dashboard for others to enjoy.
Was it worth the time it took? Well. That is always a difficult question. I could have done many other things in a full 12 hours of work. But good monitoring is essential, and investing some time in it is often time well spent. FreeBSD really needs to get some nice exporters so we can join the Prometheus party which is well underway. Considering that many other FreeBSD admins can hopefully see some benefit from the work I've done today, then I think it was well worth it.
The final hour or so was spent writing this blogpost, and now it is time to join my wife for a few episodes of Voyager. I feel like I earned it today!